Episode 12: Inferential Statistics and Hypothesis Testing Playbook
This post acts as a handy cheat sheet on how to draw important inferences from a given dataset using statistics and hypothesis testing.
Dataset:
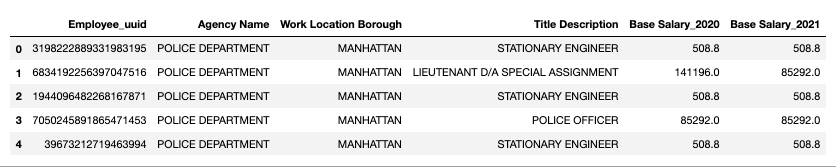
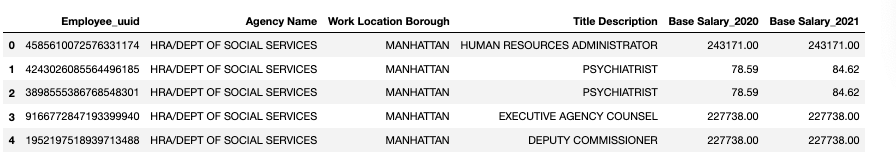
Citywide Payroll Data (Fiscal Year) was taken from “Data.gov”. Each record represents the following statistics for every city employee:
Agency, Last Name, First Name, Middle Initial, Agency Start Date, Work Location Borough, Job Title Description, Leave Status as of the close of the FY (June 30th), Base Salary, Pay Basis, Regular Hours Paid, Regular Gross Paid, Overtime Hours worked, Total Overtime Paid, and Total Other Compensation.
For the purpose of simplicity, I have extracted the base salaries of only two departments i.e. Police department and Social Services for fiscal years 2020 and 2021 and have taken a subset of relevant columns.
Concepts:
- Step 0: Descriptive statistics and their interpretation.
We use the Data Analysis toolpack in Excel to quickly get descriptive stats for the two departments. Refer to sheet “descriptive_stats” in inferential_stats_case_study.xlsx [1].
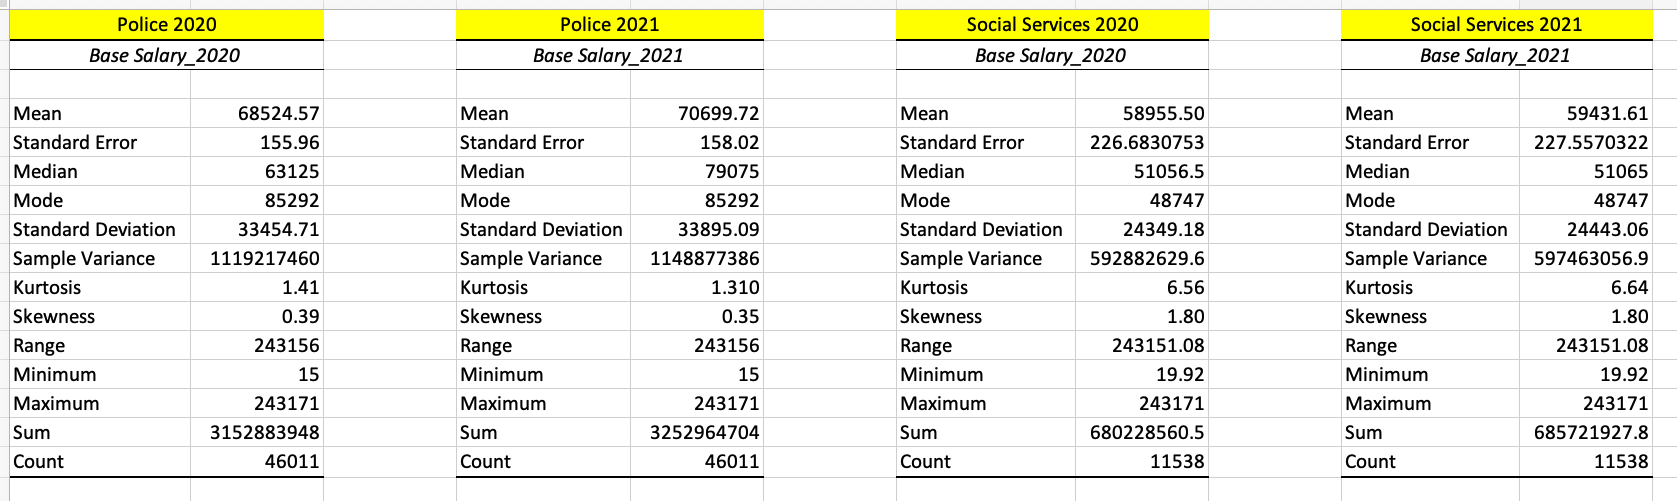
We make the following observations and come up with relevant questions related to these observations which we will later answer through various statistical tests:
- The police department has on average higher salary than social services.
- Is this difference statistically significant?
-
The police department’s salaries vary a bit more than the social services department as shown by the standard deviation.
- Median salary is lower than mean salary (excluding Police 2021).
- This implies a right/positive skew.
- But the small value for “Skew” for police shows that the tails don’t extend too far to the right.
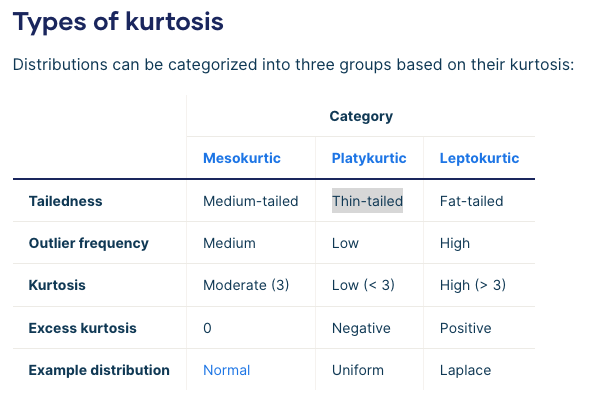
- Kurtosis less than 3 also shows that the distribution for police’s salaries is thin-tailed and outlier frequency is low.
- Kurtosis is > 3 for Social Services which implies a higher outlier frequency and fat-tailed distribution.
Inferential Statistics:
There are 3 main themes in inferential statistics and 2 subsequent hypothesis tests:
- Confidence Interval for Mean, Single Population.
- Population Variance Known (z-test).
- Population Variance Unknown (t-test).
- Confidence Interval for Mean Difference, Dependent Samples:
Example: Calculate the change in mean salary of NYPD from one year to the next. - Confidence Interval for Mean Difference, Independent Samples:
- Population Variance Known (z-test).
- Population Variance Unknown (t-test).
- t-Test: Paired Two Sample for Means:
Example: Testing whether change in police salary from one year to the next was statistically significant. - t-Test: Two-Sample Assuming Equal Variances:
Example: Testing whether the difference in police salary and social services salary is statistically significant.
Confidence Interval for Mean, Single Population:
- Step 1(a): If we know the population variance for the salary of each department, calculate the confidence interval for the mean salary of a police officer and a social worker in New York for the year 2020. Assume that the police department’s salary has a population standard deviation of $80k and social services has a population standard deviation of $60k.
Refer to sheet “1. Known variance, CI, z-table” in inferential_stats_case_study.xlsx [1].
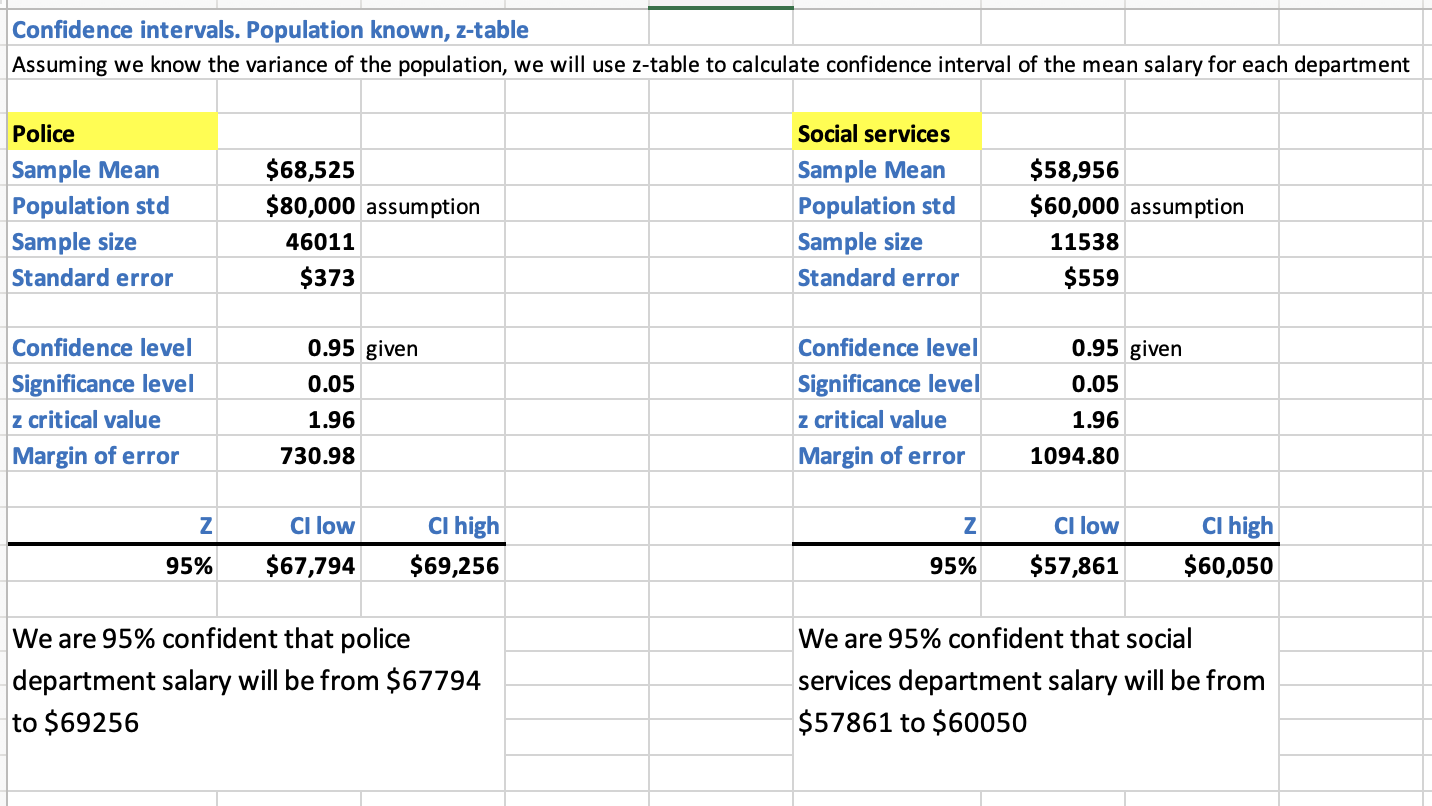
Interpretation: We are 95% confident that a police officer's salary was from $67,794 to $69,256 and a social worker's salary was from $57,861 to $60,050 in NYC in 2020.
- Step 1(b): If we do not know the population variance for the salary of each department, calculate the confidence interval for the mean salary of a police officer and a social worker in New York for the year 2020.
Refer to sheet “2. Unkown var, CI, t-table” in inferential_stats_case_study.xlsx [1].
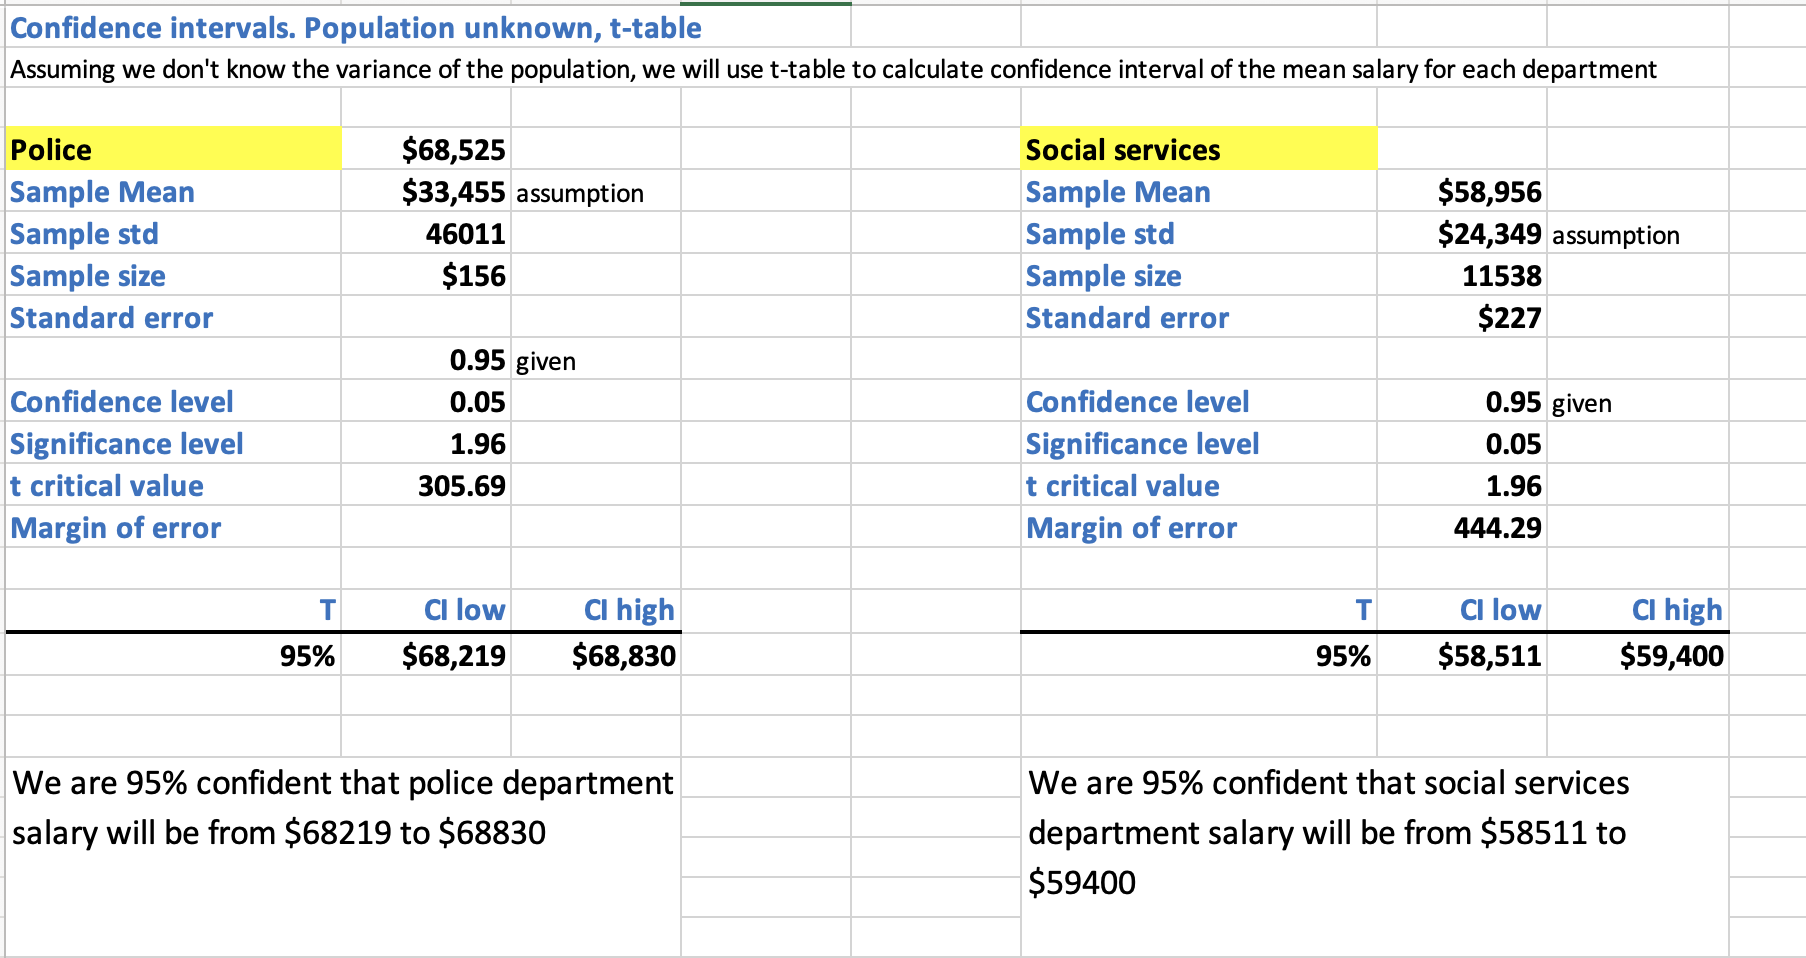
Interpretation: We are 95% confident that a police officer's salary was from $68,219 to $68,830 and a social worker's salary was from $58,511 to $59,400 in NYC in 2020.
Confidence Interval for Mean Difference, Dependent Samples:
- Step 2: We are interested in knowing the salary increase for each department from 2020 to 2021. Calculate the confidence interval for that increase with 95% confidence.
Refer to sheet “3. Two Means Dependent Samples” in inferential_stats_case_study.xlsx [1].
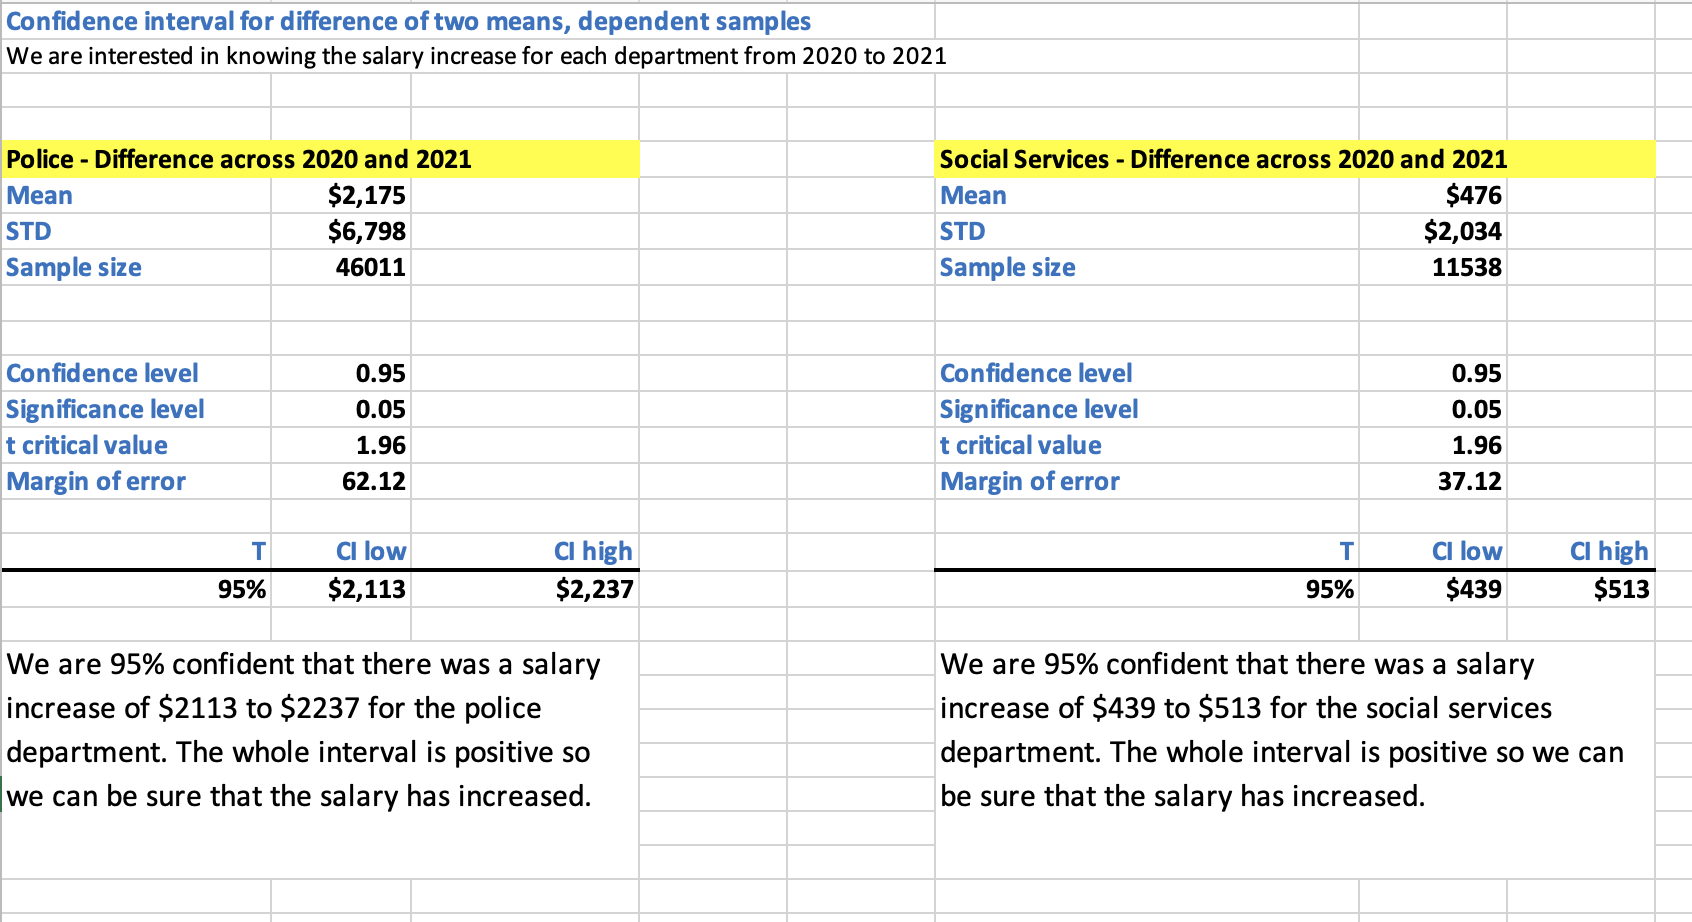
Interpretation: We are 95% confident that there was a salary increase of $2,113 to $2,237 for the police department. The whole interval is positive so we can be sure that the salary has increased. We are 95% confident that there was a salary increase of $439 to $513 for the social services department. The whole interval is positive so we can be sure that the salary has increased.
Confidence Interval for Mean Difference, Independent Samples
- Step 3(a): We are interested in knowing the salary difference between police and social services. Calculate the confidence interval for that difference with 95% confidence. Assume that the police department’s salary has a population standard deviation of $80k and social services has a population standard deviation of $60k.
Refer to sheet “4. Two Mean Ind Samp, known var” in inferential_stats_case_study.xlsx [1].
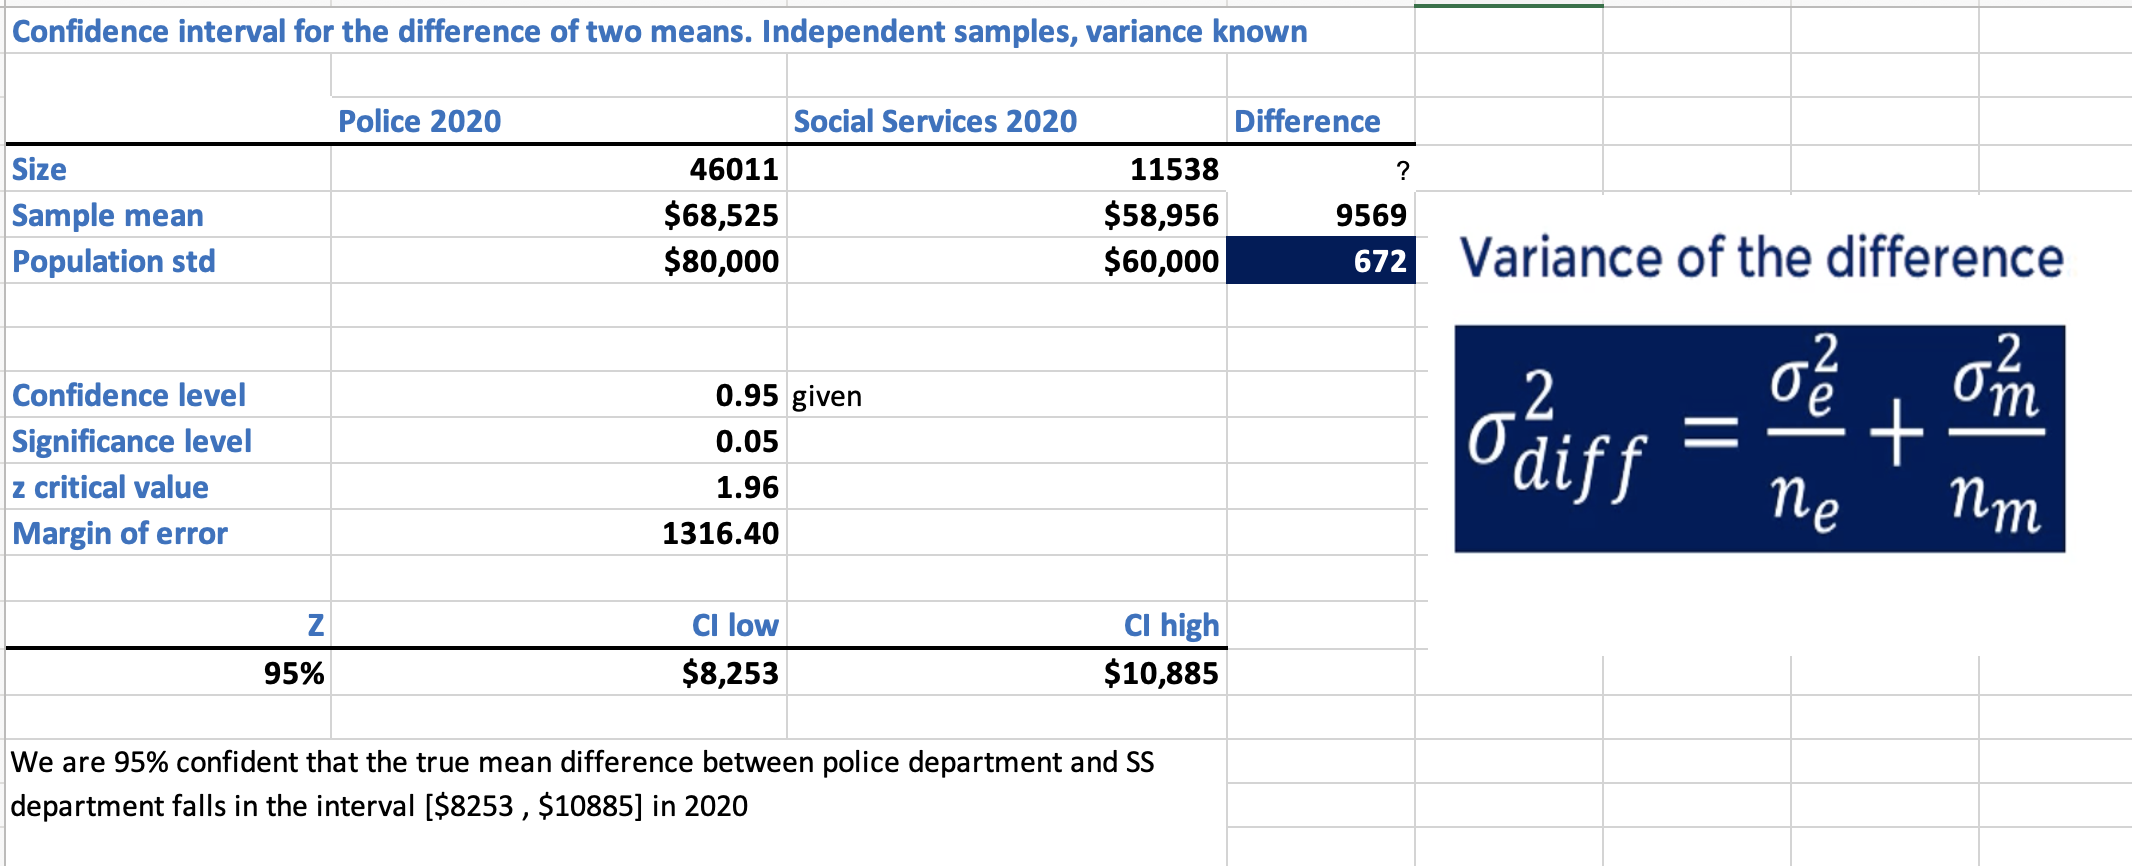
Interpretation: We are 95% confident that the true mean difference between police department and Social Services department falls in the interval [$8,253 , $10,885] in 2020.
- Step 3(b): We are interested in knowing the salary difference between police and social services. Calculate the confidence interval for that difference with 95% confidence. We do not known the population variance but we know it’s almost equal for both departments.
Refer to sheet “5. Two Mean Ind Samp, unkwn var” in inferential_stats_case_study.xlsx [1].
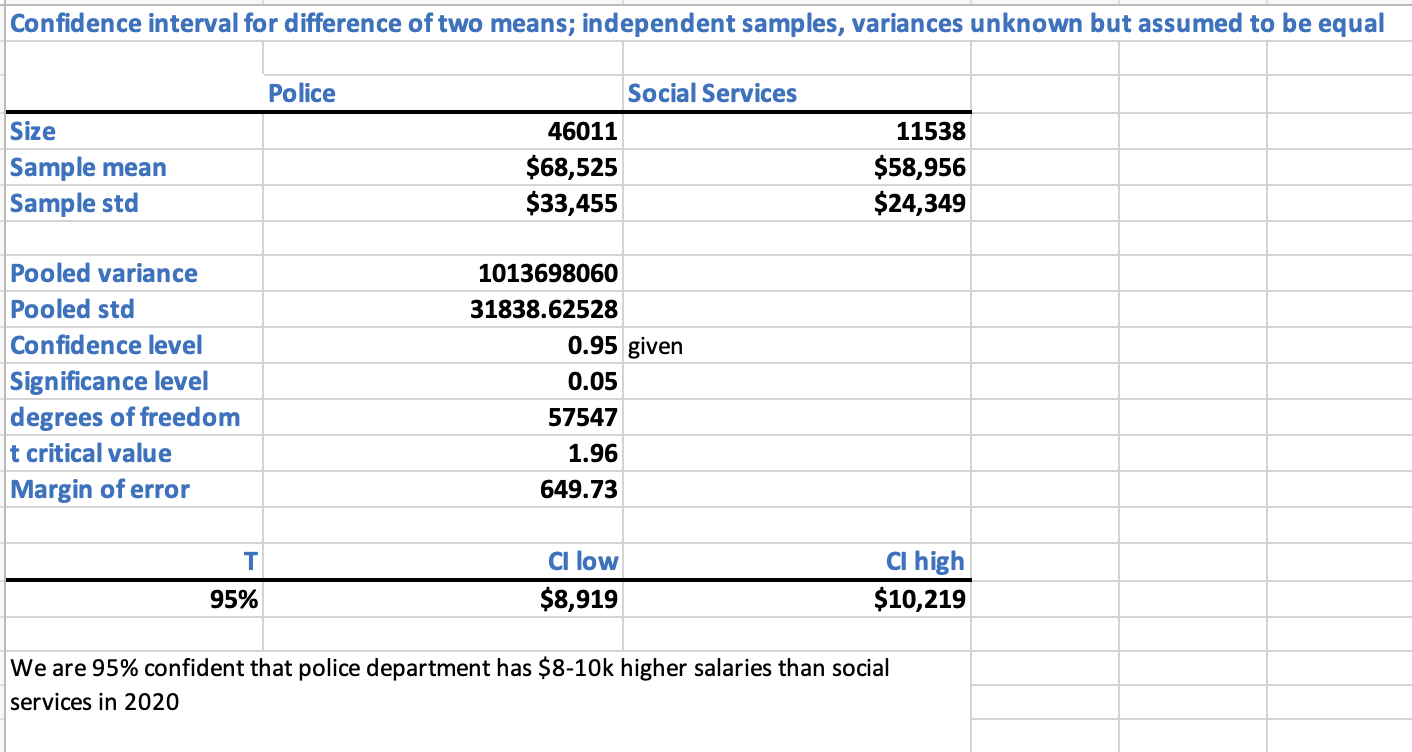
Interpretation: We are 95% confident that police department has $8-10k higher salaries than social services in 2020.
Hypothesis Testing
t-Test: Paired Two Sample for Means:
- Hari Singh is a pessimistic police officer and says there was no significant increase in NYPD salaries from 2020 to 2021. Run a hypothesis test to prove him right or wrong. Run a similar test for Social Services department.
We use t-Test: Paired Two Sample for Means from Data Anlysis Toolpack in Excel.
Refer to sheet “8. Test for mean. Dep samples” in inferential_stats_case_study.xlsx [1].
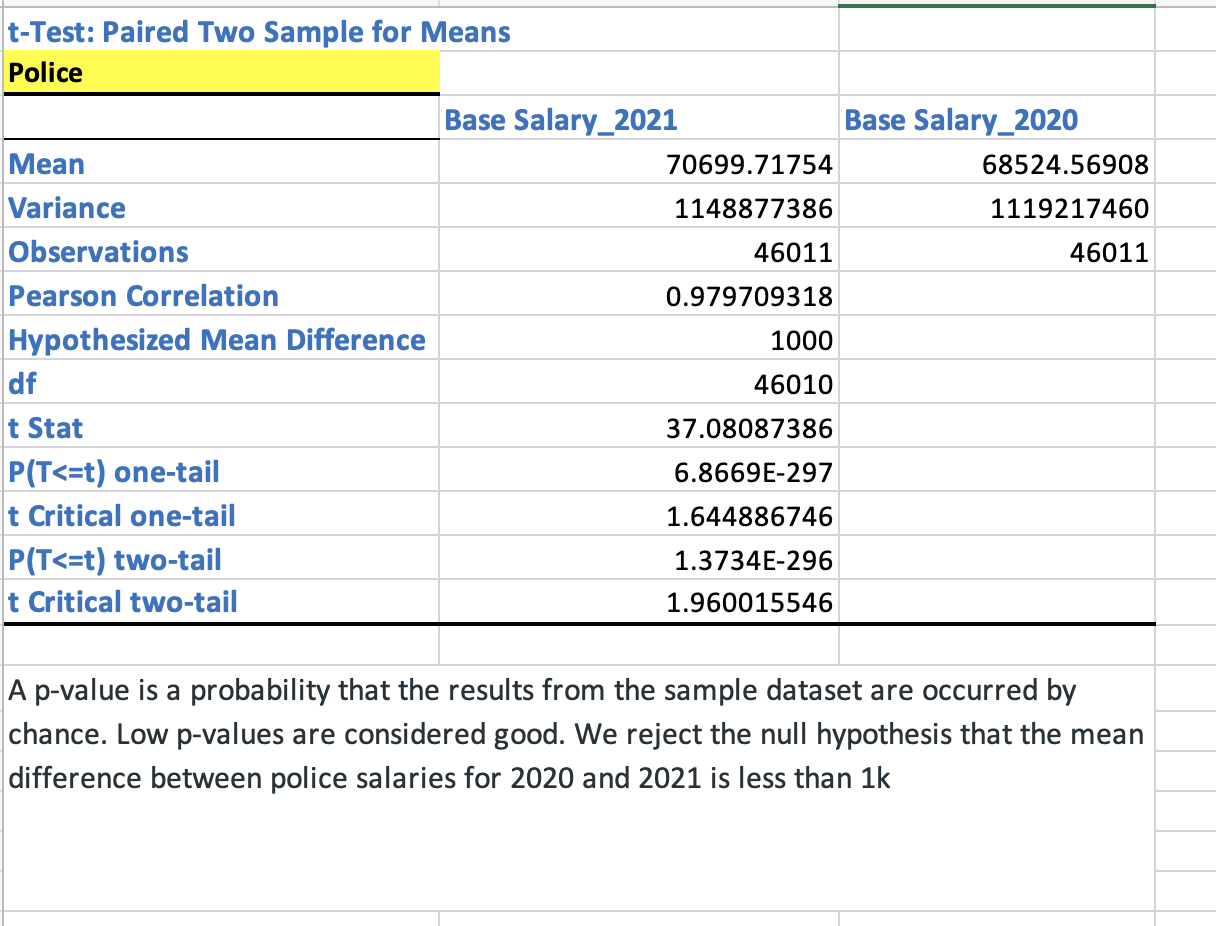
- We say that the null hypothesis is that the difference in salaries in 2020 and 2021 is less than or equal to $1000.
- A p-value is a probability that the results from the sample dataset are occurred by chance. Low p-values are considered good. Small p-value shows that we can reject the null hypothesis.
- We reject the null hypothesis because t Stat 37 > t critical one-tail of 1.64.
- Hari Singh is wrong. NYPD's salaries have increased from 2020 to 2021.
t-Test: Two-Sample Assuming Equal Variances:
- Christina works in NYC’s social services department and thinks that NYPD is being paid $10k or more on average than SS department. Run a hypothesis test to prove her right or wrong.
We use t-Test: Two-Sample Assuming Equal Variances from Data Anlysis Toolpack in Excel.
Refer to sheet “10. Test for mean, Ind samples” in inferential_stats_case_study.xlsx [1].
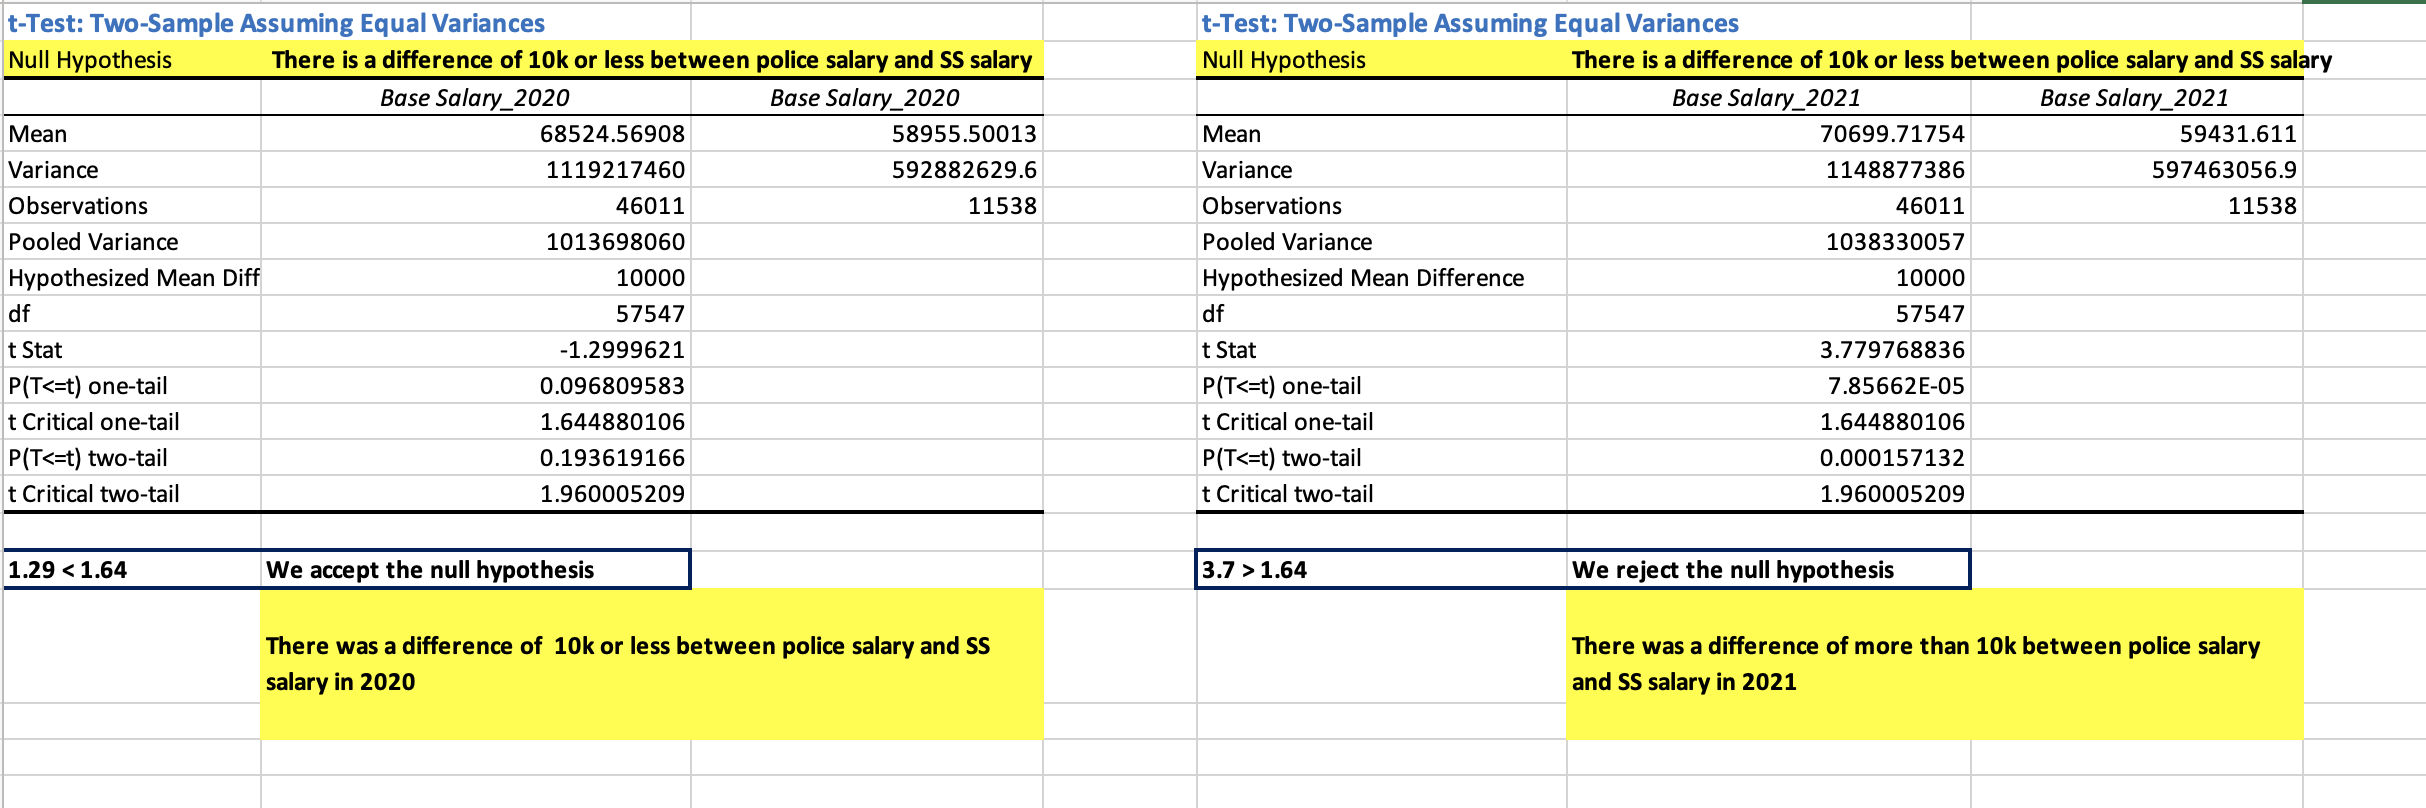
Christina is wrong for 2020 but spot for 2021! Social services was paid less than NYPD in 2021 by more than $10k.
Thought of the Week:
During my work as a data analyst, I generally enjoy presenting cool, new data visualizations to stakeholders across diverse departments and love walking them through complicated dashboards and wacthing them have their Aha! moment when they derive useful insights. However, sometimes I have struggled to push back on certain KPI requests that I find rather redundant and have a hard time explaining to executives that adding more metrics to dashboards won’t necessarily be useful.
A few days back, I came across an interesting article titled “Metrics-Focused Data Strategy with Model-First Data Products - Issue #48” by a group of analysts who write for Modern Data 101. They touched upon the concept of “The Metric Dependency Trees”. In their own words, “The objective of the metrics dependency tree is to understand what positively or negatively triggers the targeted metrics and then aid informed actions to pump the metrics as required. In other words, the metrics dependency tree is a brilliant way to instantly find the root causes (RCA) behind business fluctuations and solve them just as quickly. The metric tree also sheds light on the potential of new or enhanced metrics (metric evolution).”
This is something that a lot of us data analysts can keep in mind while engaging with stakeholders! Check out the complete article here [2].
Until next time!
References:
[1] Excel Workbook
[2] Metrics-Focused Data Strategy with Model-First Data Products